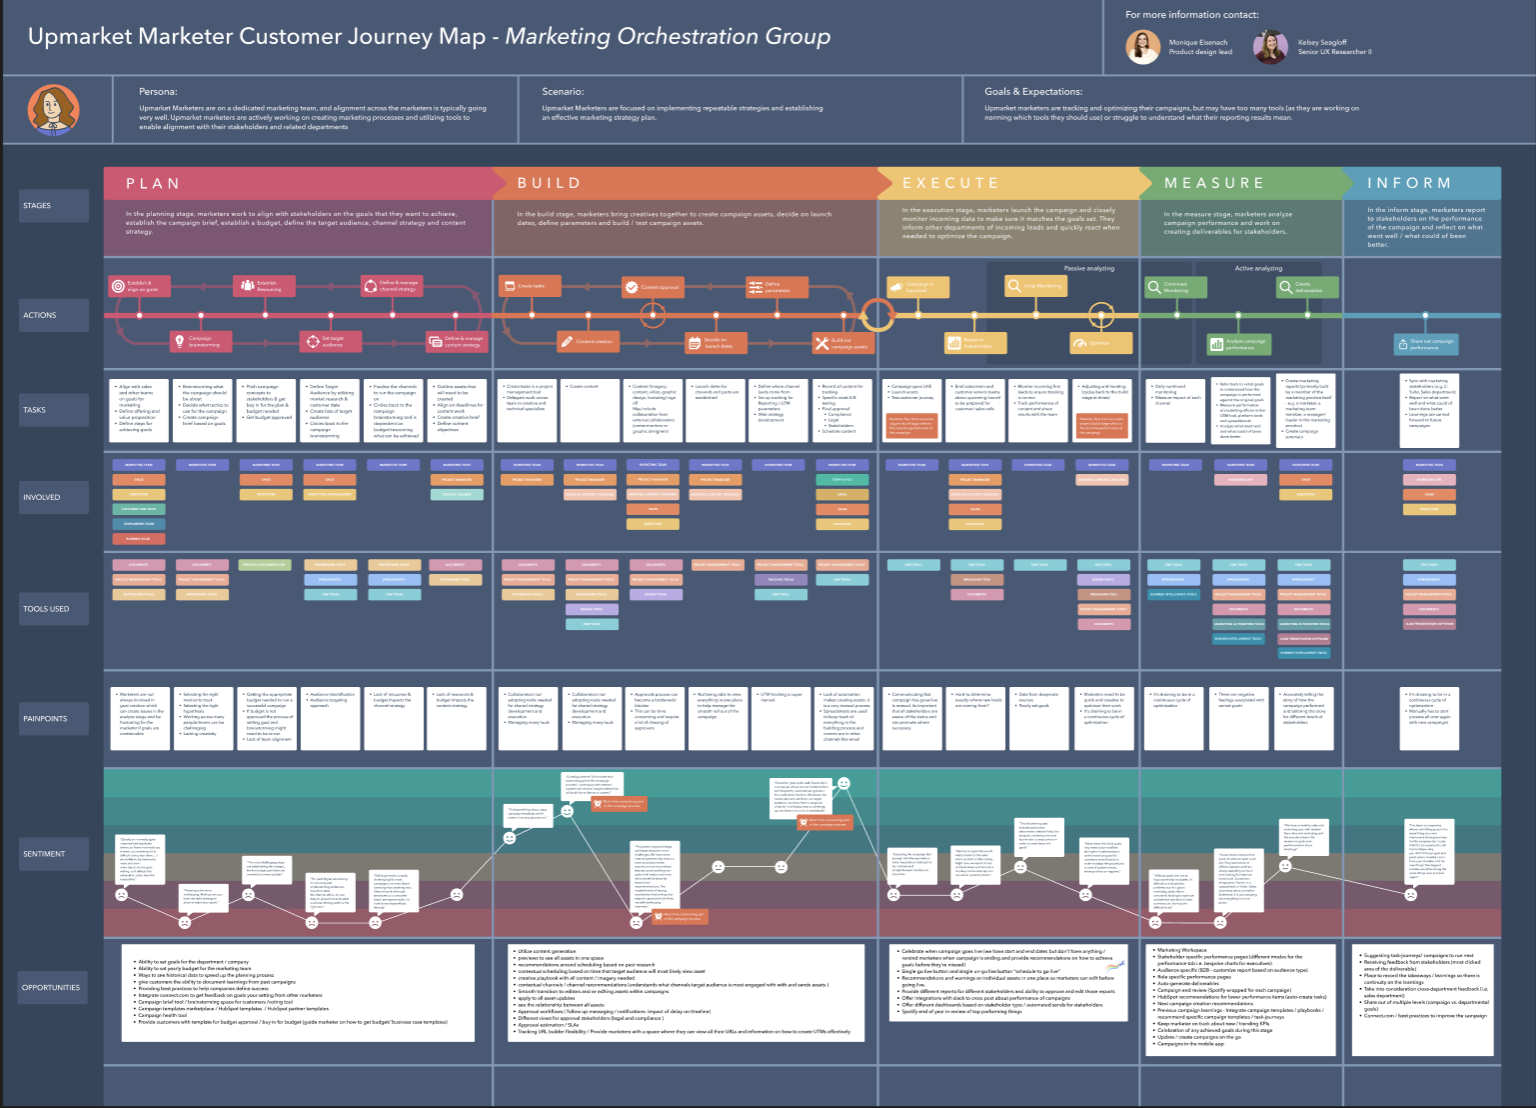
The campaign creation and management user journey map has become a main artifact that we use to align on the work we do in the Marketing Orchestration group, along with inform our cross-functional team partners of our customer’s typical process for creating and managing their campaigns.
Product Design Lead @HubSpot
In partnership with Kelsey Segaloff, Senior UXR II
User research support, Journey map ideation workshops, Drafting and finalizing the journey map.
It all started with a research study
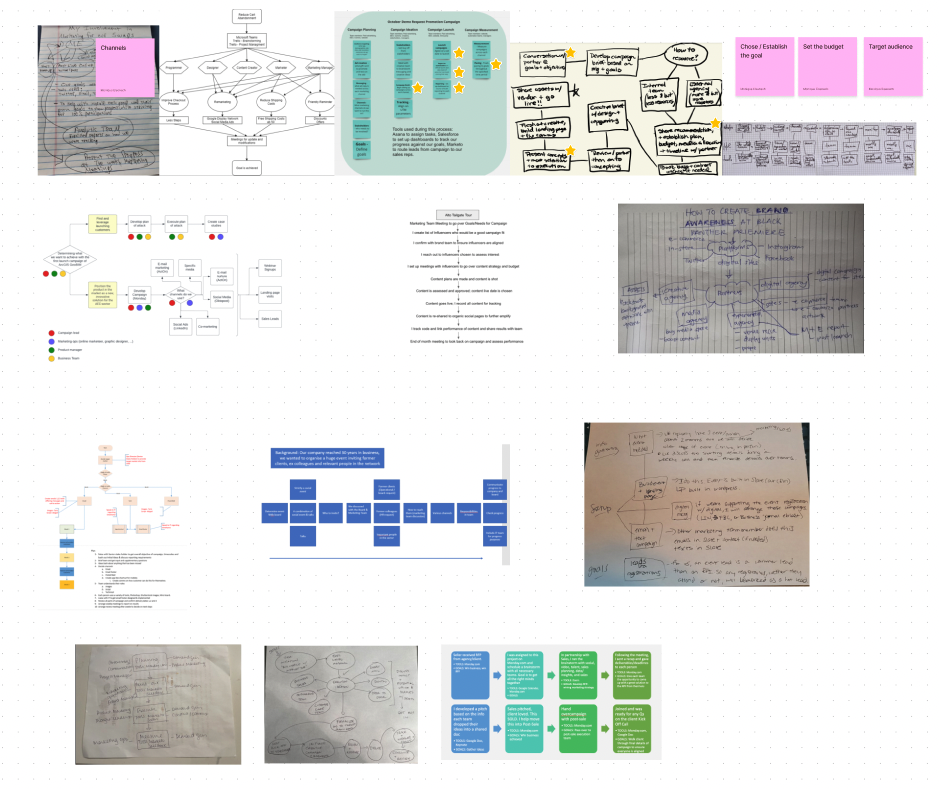
A 3-day in-depth qualitative study with a mix of customers and non-customers. The participants completed many activities such as describing the challenges and successes of running campaigns, outlining how goals are tracked for a campaign, and creating a diagram of the campaign process. After collecting all the information and diagrams I, the design lead for the Marketing Orchestration group , brought the team together to create a single journey map that encompassed the core structure of each of the diagrams and brought in elements of previous research as supporting information.
The journey map has been be used to visualize the process that our primary persona, the Marketer, goes through when running a campaign to accomplish a marketing goal. The focus of this artifact was to capture research insights, as well as to uncover the end-to-end experience marketers go through when developing a marketing campaign. Link to diagram activity and all other research activities run by Kelsey Segaloff.
Working sessions to develop the journey map
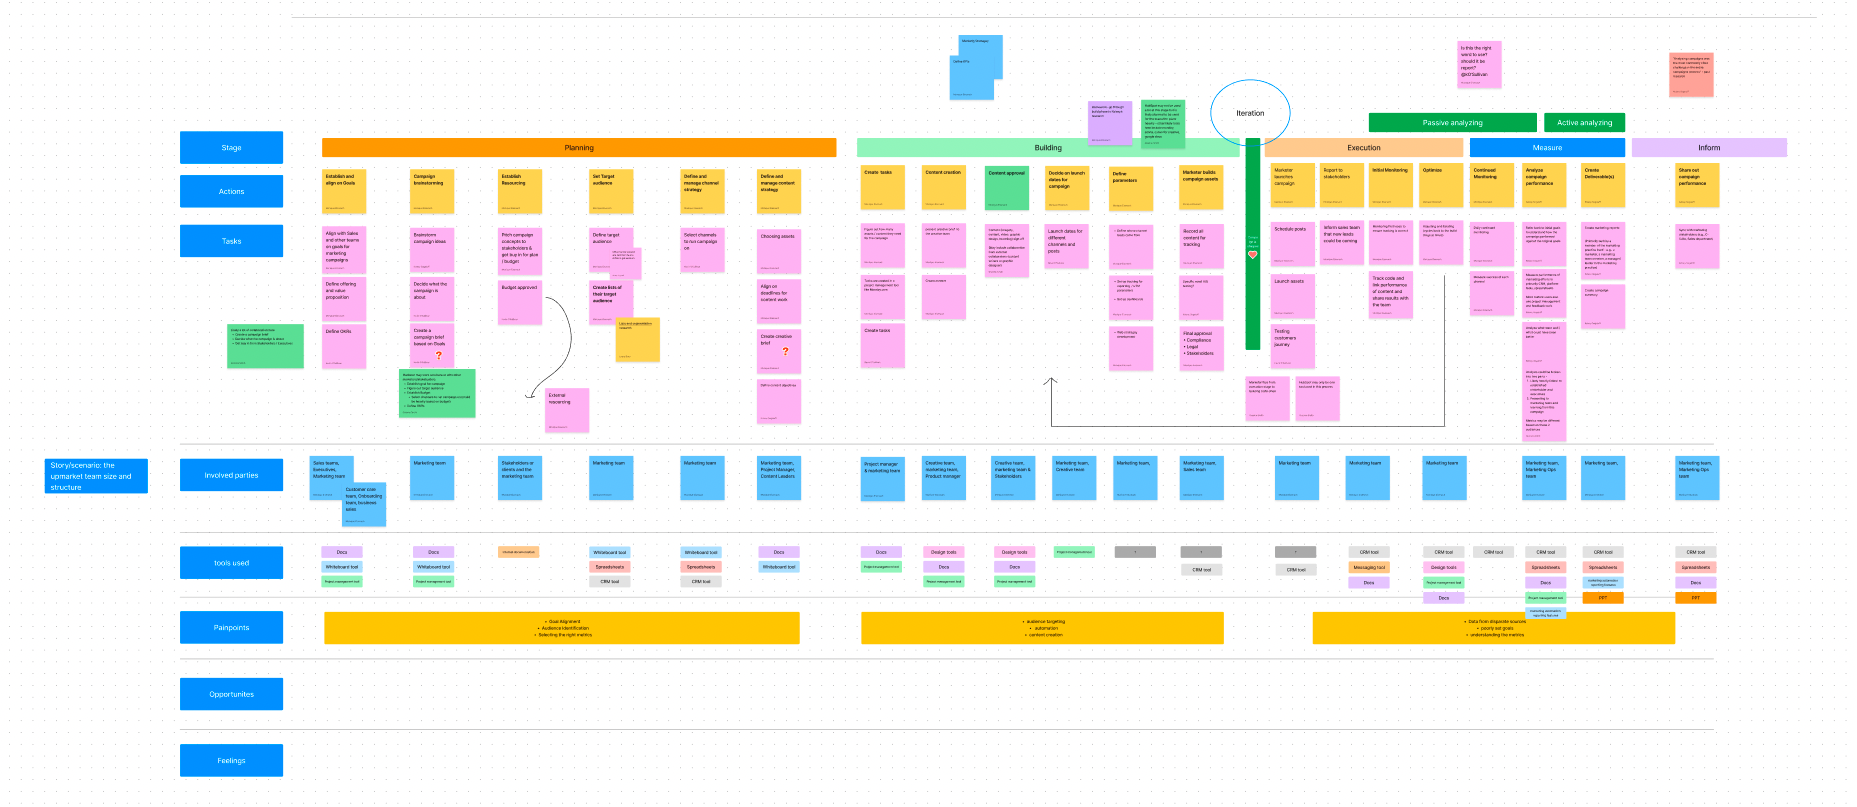
In January 2023, we kicked off mapping the marketers journey with many group working sessions. I arranged the sessions with our group’s Principal Designer Gráinne Smith and Researcher Kelsey Segaloff. During this time we sifted through the data, took time to study the diagrams, and collaboratively assembled the first draft of the map using Figjam.
We'd make large strides forward in these collaborative sessions. Post-session I continued to progress the map async until the next biweekly check in/group working session.
In the draft we discussed the structure of the map and laid out the different sections - Stages, Actions, Tasks, Involved, Tools used, Pain Points and Sentiment. We discovered that campaigns follow a four stage process of Plan, Build, Execute, Measure and Inform. Underneath each stage we mapped out the actions that a marketer would take to complete the stage. The actions had many associated tasks. Each task may need another party to be involved or informed of the progress (for collaboration, delegation, or approval). When looking at the tasks we were able to work out the tools that might be used to complete the task from previous research and marketers descriptions of the various tools they use.
To plot the sentiment section of the journey map we relied on the ‘Challenges and Successes’ activity of the research to establish the high points and low points of running a campaign. Once we had an idea of the peak and trough, we examined user quotes describing their working day to plot points along the sentiment chart. A trend emerged that planning the campaign was the most difficult stage for marketers; many people are involved, the process is messy and unclear at this early moment. Building is the most time consuming stage (delayed by approvals) but also it is the most satisfying stage for the marketer as everyone knows what they are doing, they can own their work and show their skills. If the Planning stage is a challenge, this affects Measure and Report stages as the goals and objectives are not clearly set.
Refining the draft
Once we had completed the draft, established the structure for the journey map and broken out all the various sections based on the information we had collected, it was time to refine the design. We intended the journey map to be used as a tool for us in planning and scoping exercises, for this it needs to be visual and operate like a living document to work with stakeholders.
I went through many ideas and iterations of how I could visually represent all the information in a way that's engaging, easy to understand, and still holds all the details. I took inspiration and aligned with the visual styling of the research report put together by Kelsey; this helped to link all the work.
Using the journey map going forward
Below the sentiment section we added sections relating to Opportunities, Health Check, and Horizons. These sections would be used to work through brainstorming sessions of how we could elevate the marketers experience within HubSpot to address some of the issues illustrated in the map.
Opportunities would be used to blue sky ideate on where we felt as a group we could improve the marketers journey. The Health Check allowed us to see how our current Marketing Hub experience measures up against the marketers journey, current features for tasks and areas of the product that are true to the lived experience of marketing. The Horizons section will be filled with all our 'in the near future' projects relating to moving the needle on health check items and improving specific parts of the journey.


